18005701916
Give us a callinfo@vcbl.bank.in
Mail usFinancial Information
Financial growth
The business fundamentals of the bank are very strong. This can be seen from our growth charts as well as our growing customer base. The Banks Capital Reserve Adequacy Ratio (CRAR) stood at 20.56%, Gross NPAs are 1.42%, and Net NPAs are 0% at the end of last financial year (31 March 2026). The Deposits of the banks crossed over Rs.4594.97 Crores and Loans & Advances about Rs.3877.42 Crores by 31 March 2026. The business turnover is about Rs.8472.39 crores.
Financial Indicators
| Financial Indicators | ( Rs in Crores) | ||
|---|---|---|---|
| S.NO | Items | 31/03/2025 | 31/03/2026 |
| 1 | Deposits | 4354.73 | 4594.97 |
| 2 | Loans | 3436.47 | 3877.42 |
| 3 | Share Capital | 389.55 | 416.25 |
| 4 | Reserves and surplus | 346.99 | 365.00 |
| 5 | Net Worth | 686.19 | 721.93 |
| 6 | Investments | 1579.71 | 1471.87 |
| 7 | Profit | 71.77 | 66.15 |
| 8 | Working Capital | 5341.19 | 5631.98 |
| 9 | Net Npa Percentage | 0% | 0% |
| 10 | Net Npas | 0 | 0 |
| 11 | CRAR | 22.83% | 20.56% |
| 12 | No.of Branches | 55 | 60 |
| 13 | No.of Extention Counters | NIL | NIL |
| 14 | No.of Employees | 566 | 634 |
| 15 | No.of. Members | 111593 | 117884 |
Growth Table: The growth of the bank for the last 10 years
| Rs. In Lakhs | |||||||||
| Year | “A” Class members | Share Amount | Deposits | Growth % | Loans | Growth % | Reserves | Profit | Div/ Int on SCA |
|---|---|---|---|---|---|---|---|---|---|
| 2016-17 | 68783 | 17338.32 | 253156 | 12.21 | 173722 | 18.02 | 11795.77 | 3128.86 | 12% |
| 2017-18 | 75298 | 19348.40 | 273056 | 7.86 | 197065 | 13.44 | 14588.45 | 3370.51 | 12% |
| 2018-19 | 82229 | 21556.27 | 311013 | 13.90 | 213939 | 8.56 | 18664.87 | 3723.50 | 12% |
| 2019-20 | 87863 | 24119.20 | 352268 | 13.26 | 237886 | 11.19 | 22164.98 | 3410.95 | Not Declared /paid due to Covid-19 resturctions by RBI |
| 2020-21 | 90776 | 25140.37 | 385359 | 9.39 | 271943 | 14.31 | 26073.20 | 4511.12 | 10% |
| 2021-22 | 92200 | 27200.00 | 388928 | 0.93 | 286354 | 5.30 | 32190.10 | 6680.95 | 10% |
| 2022-23 | 97122 | 30543.03 | 392885 | 1.02 | 305282 | 6.61 | 38871.09 | 7313.54 | 12% |
| 2023-24 | 104865 | 35260.91 | 414830 | 5.58 | 319924 | 4.80 | 31645.72 | 8779.15 | 12% |
| 2024-25 | 111593 | 38954.71 | 435473 | 4.95 | 343647 | 7.42 | 34698.61 | 7176.89 | 12% |
| 2025-26 | 117884 | 41625.37 | 459496 | 5.51 | 387742 | 12.83 | 50494.73 | 6614.61 | 10% |
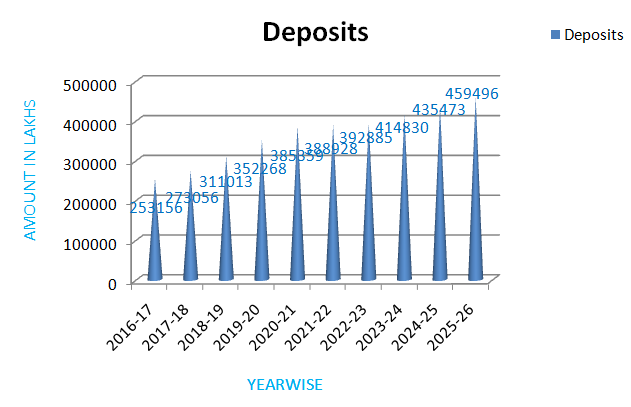
The growth of deposits for the last 10 years
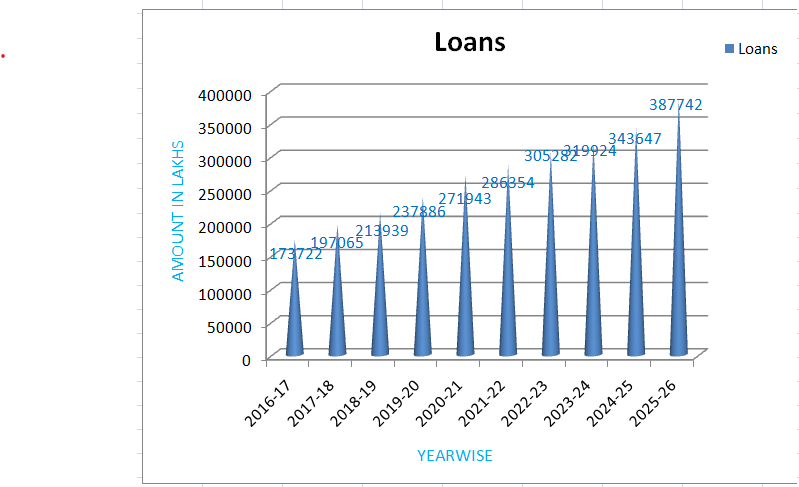
Growth Chart (Loans) :
The growth of Loans for the last 10 years.
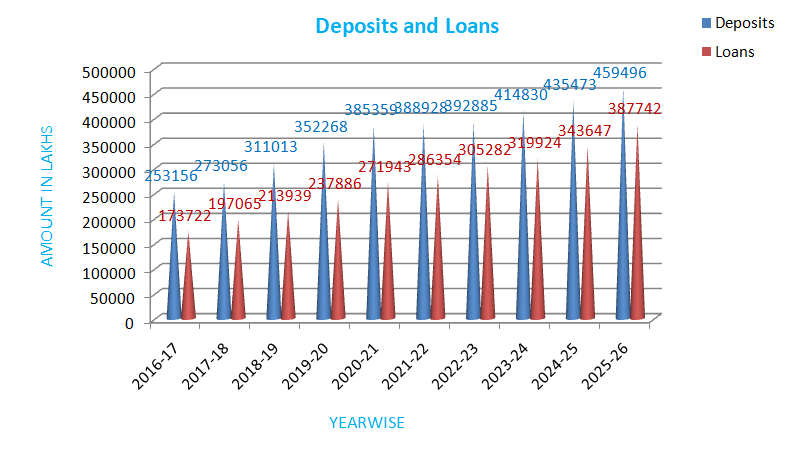
Growth Chart (Loans & Deposits) :
The growth of Loans & Deposits for the last 10 years.
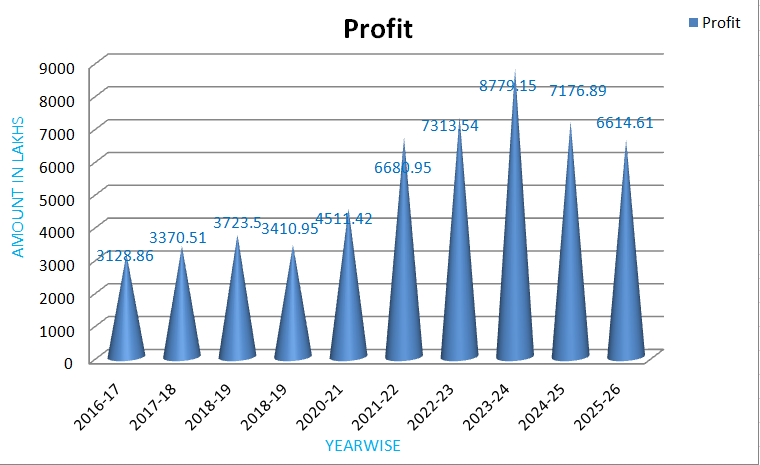
Growth Chart (Profits) :
Profit for Last 10 Years